Simulating pots in ancient Jerash
An explorable explanation of computational modelling in archaeology
Archaeologists aim to understand past societies. But it is a daunting task to reconstruct these from the fragments of pots and the trash they have left behind. Archaeology is hard!
Consider for example the goods we buy and consume. The traces we leave behind after consuming something (like seeds or bones remaining at the end of a meal, or fragments of a ceramic pot we bought) are a product of a lot of things: the economy, politics, religious practices but also our day-to-day choices. How then can archaeologists untangle these things? How can they study just the economic story behind these traces? How can they explore ancient individuals’ personal choices that led to these archaeological traces?
Here we will introduce an approach that can help us untangle the complexities of past human behaviour: computational modelling. It allows us to focus on individual phenomena like trade, individual preference or political regulation. By simulating their theories about these things, archaeologists can identify what evidence they would find if their theory was true, and they can test hypotheses related to their theories by comparing simulated archaeology with real excavated archaeology.
We will explore this approach together by evaluating theories of the effect of choice and personal preference on the creation of the archaeological material found at the site of Jerash in Jordan.
This is Jerash:
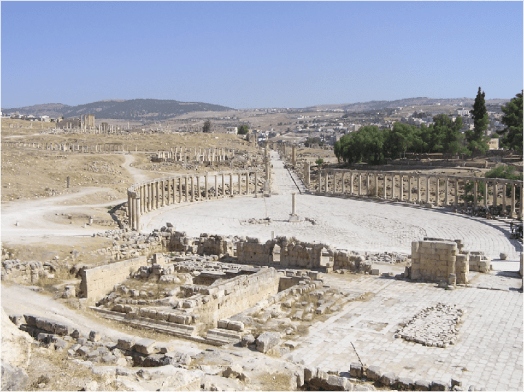
Ancient Gerasa, now known as Jerash, was a city in northern Jordan which flourished for several centuries from late Hellenistic times through the Roman, Byzantine and early Islamic periods. The city is known from ancient sources and is mentioned, among other ancient authors, by Pliny as being one of the Decapolis cities of the Roman period, all but one of which were located on the east side of the Jordan valley in southern Syria. Jerash was an ordinary middle-sized ancient city covering approximately 90 hectares within its Roman period city walls. Jerash had all the typical features of an ancient city including a network of streets, sanctuaries, a city council building also used as a theatre, bath complexes, market squares and domestic architecture. Later, numerous churches were constructed in Jerash, as well as one of the earliest mosques known to us. Jerash therefore makes a great case study for understanding how an ordinary ancient city in the region worked.
However, something curious about Jerash is that almost all of the ceramic remains found here were locally produced during a period of six centuries (more than 99% of it!). Have a look at this figure showing almost a million ceramic pottery shards from across the site of Jerash and dated to a period of six centuries from the Roman to the early Islamic period: just a handful are overseas or regional imports!
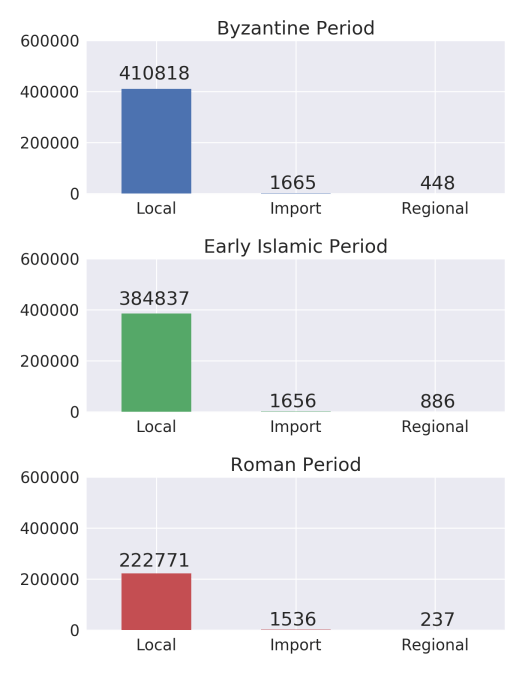
This phenomenon is quite unique, especially since other urban centres in the region and other Decapolis cities show more diversity in the ceramics found there.
There are a couple of hypotheses to explain what’s happening:
- Jerash was too far away from the coast and major roads to get imports?
- Jerash was too small a town to be attractive to foreign traders?
- Jerash did not have a need for imports because it was a big producer itself?
- Jerash had other priorities and spent its money on different goods and projects?
These are all fine explanations, but they cannot explain the extreme nature of the data pattern: for six centuries this middle sized city that has plenty of evidence of imported goods other than ceramics and of being strongly politically integrated with the Roman and later Byzantine empire, has hardly any evidence of imported pottery and has little diversity in pottery shapes for a period of six centuries! Think about that for a moment: for 600 years the tens of thousands of inhabitants of the city were perfectly content with using the same shapes of bowls and cups whilst the political context changed dramatically following the fall of the Roman empire in the west, and the rise of Islamic empires.
This is why we want to explore other theories as well. Can a personal preference and individual choice for locally produced ceramics explain this archaeological material?
Now you might think that this is an easy and intuitive question to answer. Surely if the people of Jerash had a preference then we would just expect the local product to be far more common than the imported product. However, we will show that even simple theories can have unexpected and counter-intuitive results, and that this problem is magnified tenfold when we combine different theories in a single model!
This is why we need computational simulation modelling! To help you reason rigorously about the implications of different theories, to be able to distinguish between the effects of different theories, and to be able to say something about the probability of different theories.
Let’s make our first computational model of pottery preference. Say we go to the Jerash market and there are two kinds of pots, local and imported (on the left and right of the figure below). For the moment both are equally available on the market place, and the inhabitant of Jerash prefers one more than the other. You can simulate what the difference is for the proportion of local VS imported ceramics by changing a slider representing buyers’ preference for one or the other product:
[iframe src=”https://evoluchico.github.io/jerash/files/run_simulation.html?sim=sliders_01.js” width=”500px” height=”463px”]
This is a simple simulation of the broken pots that this buyer would leave behind over their lifetime. For instance, if the preference is 50%-50%, they’ll probably leave a 50/50 pile of pots behind. Maybe 49/51 or 51/49 because in simulations like this the preference slider represents a probability that a certain pot will be bought, not a certainty. If their preference is around 75%-25%, the distribution of pots will probably be around 75/25 as well.
It might seem a bit simplistic to think that individual preference alone can account for the bias towards locally produced products found in Jerash. Let’s consider an alternative. Suppose that Jerash potters had been making pots for a long time before imported pots were introduced in the market. This might get reflected in the archaeological record by a significant bias towards local products as they simply had more time to accumulate.
We can easily add this new factor to our previous simulation using a new slider. This slider will determine how long it took for the foreign pottery to be introduced to the Jerash market. Note that if we set the time ‘gap’ to zero, then our simulation behaves exactly like the one above. Can you get a big discrepancy in the amount of pottery even without a strong preference towards either type of pottery?
[iframe src=”https://evoluchico.github.io/jerash/files/run_simulation.html?sim=sliders_02.js” width=”500px” height=”508px”]
Hopefully, you have been having fun playing with the two previous simulations. But you might have started to wonder how this can be used to aid in your academic endeavours to understand the past. In other words, is this just play, or can we learn something from it?
So far we have been playing with two sliders: pot preference and the temporal gap between the availability of each pot in Jerash. One thing that we might want to know is what combinations of preference and temporal gap would explain our archaeological data.
Before we analyse the results for our simulations above, let’s talk through a very simple example. Imagine each of the two sliders only had three options. That would give us a total of nine (3×3 = 9) combinations that we could simulate, and we can visualize this as a 3×3 grid as in the figure below. At the end of each simulation we could compare our results to our data. If the simulation looks like our data, we can colour it green, and if the simulation result is very different from the data we can colour it pink.
[iframe src=”https://evoluchico.github.io/jerash/files/run_simulation.html?sim=heatmap_small.js” width=”500px” height=”753px”]
Hopefully, after this simple example you now feel more comfortable with reading this type of graph. It is important to highlight that knowing the value of one of our sliders is not always enough to predict whether our simulation will reproduce our data. Instead it is the combination of slider values that really matters. How important is each slider (i.e. each theoretical explanation) for explaining the data? Does one slider have a bigger effect on changes in the data than another?
Now let’s see what this really looks like for our simulations when we consider the full spectrum of slider settings, and not just 3×3 settings. On one axis you will see the values of the preference, and on the other you will see the values for the temporal gap. The colour of each point in the graph will tell you the percentage of local pottery that the model predicts: the dark green zone of slider settings explains more than 99.8% of the data pattern, whereas the dark purple zone explains less than 20%. When you hover your mouse over each of these zones you will see a little animation as an example of this combination of slider settings. If you are using Firefox, the animation might not work. Try another browser (e.g. Chrome, Safari, Edge).
[iframe src=”https://evoluchico.github.io/jerash/files/heatmap_large.html” width=”520px” height=”710px”]
We are going to address one last hypothesis in this explorable explanation: differences in the frequency with which different pots were used in Jerash households. Imagine as an analogy the crockery at your grandparents’ house: some plates and cups are for everyday use and therefore have a much higher chance of breaking and being replaced with new item, whereas another set of plates and cups would be safely stored in a wooden cupboard only to be taken out at special occasions like Christmas and when the queen visits. The latter pottery would not have as much probability of breaking and being replaced simply because it is used less frequency.
We could hypothesise that local Jerash pottery is overrepresented in the archaeological record because it is daily use pottery that breaks frequently and needs to be replaced, whereas imported pottery is handled less frequently and with more care. To consider this hypothesis, we are going to have to make some changes to our model as we will now need to make a distinction between buying pots and them forming part of the archaeological record as broken pots.
We assume that the number of pots in a household is going to be constant, so when a pot breaks it will be replaced by a new pot. The type of pot that is bought will depend on the preferences of pot type: i.e. the new pot bought to replace a broken pot is not necessarily of the same type as the pot that broke. The more frequent a type of pot is used, the more likely this type of pot will end up on the pile of discarded broken pots. In this model you can see on the left the number of pots in the household, and on the right you see the broken pots that are discarded and excavated by archaeologists. Try out this model by clicking the buttons to use, break and buy one pot at a time.
[iframe src=”https://evoluchico.github.io/jerash/files/run_simulation.html?sim=sliders_03.js” width=”470px” height=”780px”]
Breaking pots one by one is fun right? But it’s a bit slow and it’s hard to get an overview of what precisely the result is in the archaeological record for different slider settings. In the next model below we therefore speed things up a bit. Your preference for using either local or imported pottery is now represented by a slider. Each time you press “PLAY” the model simulates 100 times the use, breaking and buying of pots according to the slider settings (you will notice the number of pots in the house will change very quickly as the simulation breaks pots at super speed). Notice how there needs to be a really strong preference for both buying the local product and the frequency of using the local product in order to get simulation results where only 1% of the broken deposited pots is imported pottery.
[iframe src=”https://evoluchico.github.io/jerash/files/run_simulation.html?sim=sliders_04.js” width=”470px” height=”610px”]
That’s it: you have just applied computer simulation to archaeological research. This explorable explanation obviously just offered a very abstract and simplified example of archaeological research, the real stuff involves much more archaeological data analysis and computer coding work. But there’s a few things that will have become clear from this explanation:
- Complex archaeological theories can be broken into little parts and formally represented.
- By using computer modelling we can simulate the archaeological data we would expect to see as the result of our theory.
- We can determine the plausibility of our archaeological theories by comparing simulated data with actual archaeological data.
- Computer modelling allows us to specify our theories, narrowing down the influence of our theories on the archaeological record (think about the graph with the parameter space: only a tiny portion of slider settings could reproduce the archaeological data even though half of the graph represented our archaeological theory).
- Abstracting and simplifying our archaeological theories is necessary for computer simulation to work, and it’s provocative: which is a good thing! It forces us to rethink our theories and specify or reject them.
- Some archaeological theories which sound simple are intuitive can turn out to have surprising counter-intuitive results. The human brain is particularly bad at forecasting the interplay between multiple theoretical scenarios in more complex models: that’s why we use computers.
- These simple models obviously don’t capture the full complexity of the ancient inhabitants of Jerash and their relationship with pottery. They should be seen as thought experiments to be merged with traditional quantitative and qualitative archaeological approaches.
Want to play around a little bit more with simulated pots and Jerash people? Here’s a sandbox model that includes all variables introduced in this explorable explanation. Together they show a pretty complex theory of preference that can be explored in a formal way. What are your thoughts about pottery preference in Jerash? Which settings of this sandbox model seem credible and which do not? How would you expand or modify this model?
[iframe src=”https://evoluchico.github.io/jerash/files/run_simulation.html?sim=sliders_sandbox.js” width=”470px” height=”730px”]
Want to know more?
- The Danish-German Jerash Northwest Quarter Project
- Ceramics in Context Project
- Project MERCURY
- The Oxford Roman Economy Project
Acknowledgements
This explorable explanation is the result of an internship in project MERCURY by Yayoi Teramoto Kimura and Chico Q. Camargo. We thank Line Egelund Hejlskov, Mette Normann Pedersen and Mie Lind for their support and feedback. We thank the directors of the Danish-German Jerash Northwest Quarter project, Prof. Rubina Raja and Prof. Achim Lichtenberger, and the director of the Ceramics in Context project, Prof. Rubina Raja, for their support in creating this resource. The Danish-German Jerash Northwest Quarter project is funded by the Carlsberg Foundation, H.P. Hjerl Hansens Mindefondet for Dansk Palæstinaforskning, the German Research Foundation (DFG), The Danish National Research Foundation’s Centre of Excellence for Urban Network Evolutions (UrbNet) and the EliteForsk initiative. The Ceramics in Context project is funded by the Carlsberg Foundation. The MERCURY project was funded by The Leverhulme Trust as an early career fellowship awarded to Dr Tom Brughmans.
